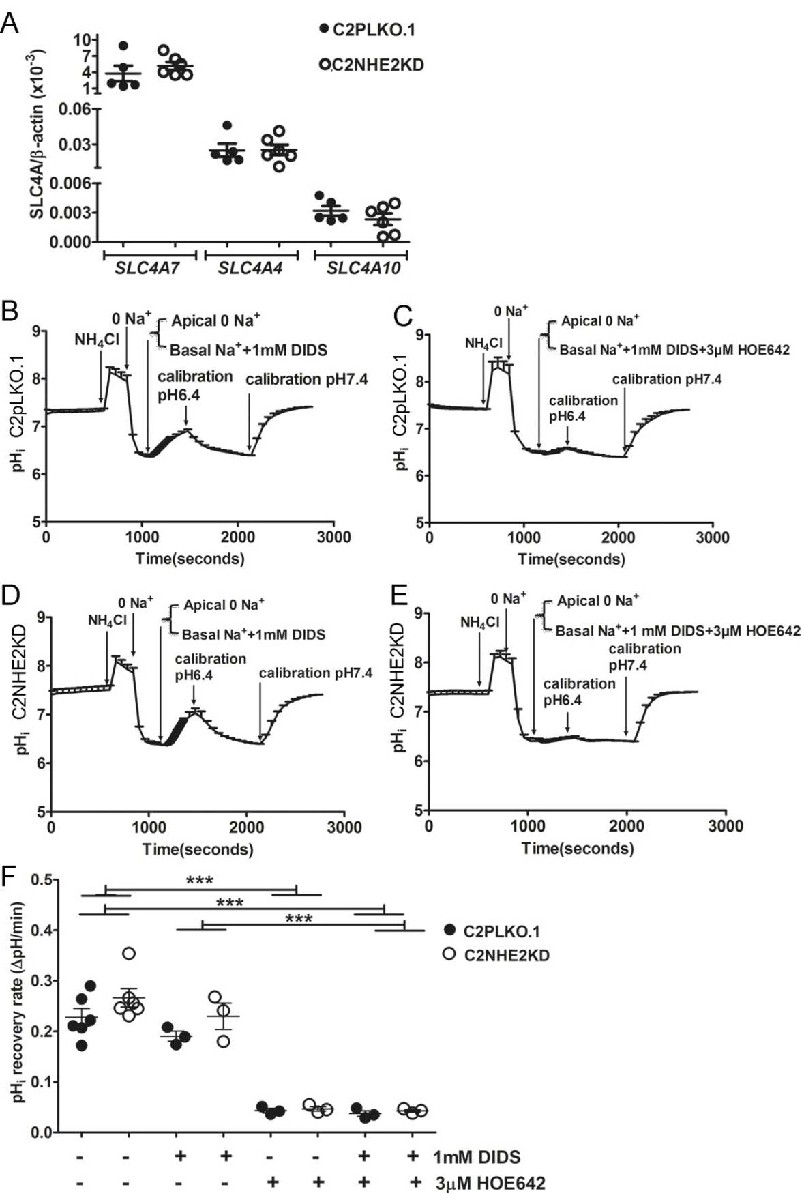
Fig. 10. mRNA expression of SLC4A7, 4 and 10 and acid-activated basolateral Na+/H+ exchange after DIDS treatment of differentiated cells. (A) Comparisons of SLC4A7, SLC4A4 and SLC4A10 mRNA expression levels between differentiated C2PLKO.1 (●) and C2NHE2KD (○) cells using β-actin as control gene. (n=5-6, mean ± SEM). Acid-activated basolateral Na+/H+ exchange after DIDS treatment of differentiated cells was performed as described in Fig. 5. and 8. Inhibitors were added 5 minutes before pHi recovery. pHi-curve of (B) C2PLKO.1 and (C) C2NHE2KD in the presence of 1 mM DIDS. pHi-curve of (D) C2PLKO.1 and (E) C2NHE2KD in the presence of 1 mM DIDS plus 3 μM HOE642, (F) comparisons of acid-induced pHi recovery rates between control, 1 mM DIDS, 3 μM HOE642 and 1 mM DIDS plus 3 μM HOE642 treatments in C2PLKO.1 (●) and C2NHE2KD (○) cells. No differences in the acid-activated basal Na+/H+ exchange rates were observed among control and DIDS perfused cells, regardless of the cell genotype. Co-perfusion with 3 μM HOE642 plus 1 mM DIDS reduced this rate to the level of only 3 μM HOE642 perfused cells in both C2PLKO.1 and C2NHE2KD cells (n=3-6, mean ± SEM, one-way ANOVA with Tukey's multiple comparison tests, ***p<0.0001).